All work

01 / 04 · Trading Infrastructure · FinTech · Web

ChartVPS

Making infrastructure easier to choose.

ChartVPS had plenty of technical information. The challenge was helping traders understand which infrastructure actually fit the way they trade.

ProjectChartVPS
RoleProduct Designer PlatformWeb ScopeProduct strategy · UX · UI CollaborationCEO · CTO · Business analyst · Support team · Dev team Timeline6 months
chartvps.comVisit ChartVPS (opens in a new tab)
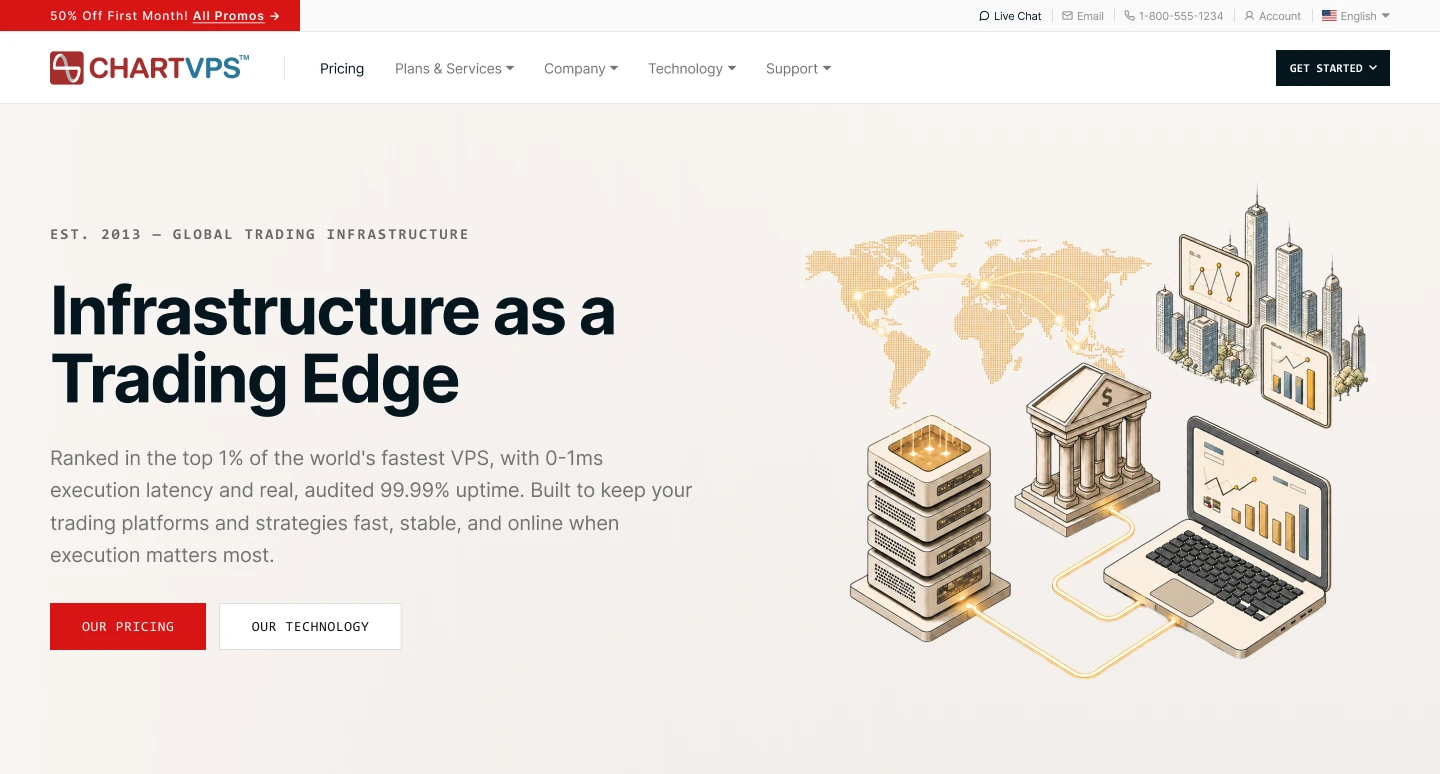
ChartVPS website home page: Infrastructure as a Trading Edge, with pricing and technology actions beside an illustration of servers, a bank and a trading laptop connected across a world map.
  1. My roleProduct designer, from product strategy to UI.
  2. ProblemTraders had to translate hardware into trading fit themselves.
  3. InsightThe gap was between the specifications and the trading decision.
  4. ApproachBefore designing screens, I designed the decision.
  5. OutcomeAll four parts shipped on chartvps.com; the support team reported fewer plan-choice questions.
01 The problemEvidence

Six factors behind one purchase.

ChartVPS sells VPS and dedicated servers to traders. They had plenty of infrastructure information, but choosing the right plan took too much interpretation.

  1. New to the decision01LatencyResponsiveness
  2. New to the decision02UptimeReliability
  3. CPU · RAM · Storage03PerformanceWorkload
  4. New to the decision04Strategy capabilityWhat it can run
  5. New to the decision05Platform requirementsFit
  6. Price06PriceValue
Four factors are new. CPU, RAM and storage don’t disappear — they’re read as performance.
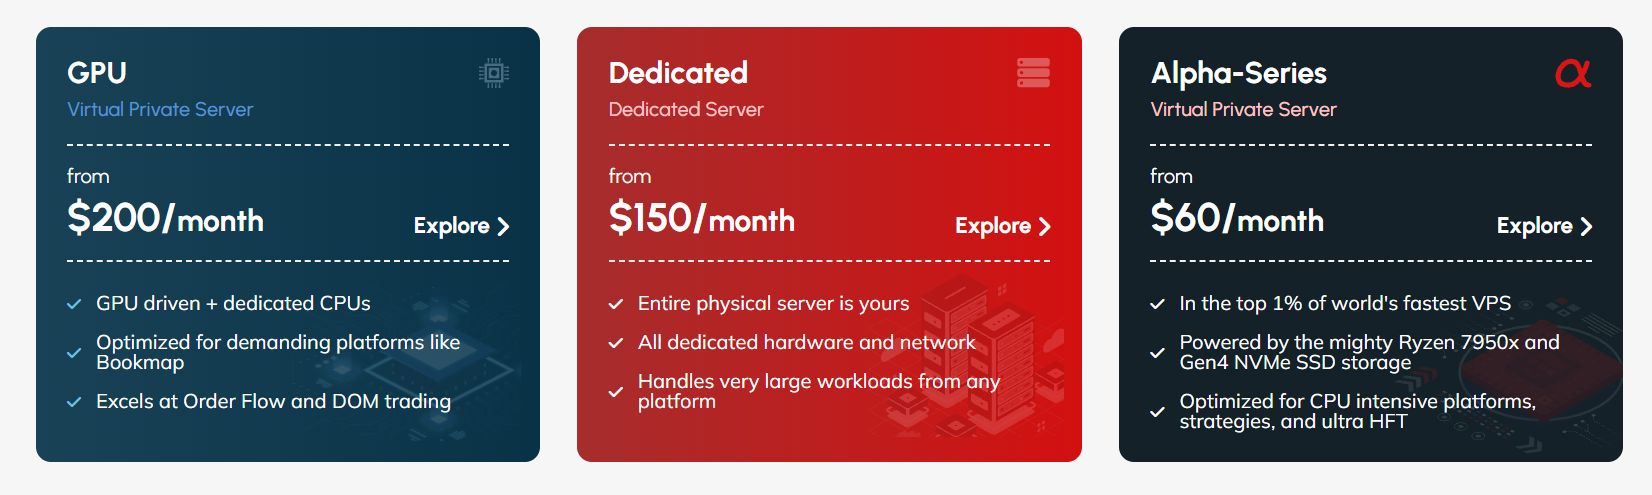
ChartVPS plan series before the redesign: three cards — GPU Virtual Private Server from $200 a month, Dedicated Server from $150 a month, and Alpha-Series Virtual Private Server from $60 a month — each with an Explore link and three feature claims.
Before the redesignThe plan series as traders met them: a name, a starting price and three claims each. No benchmark figures, latency or uptime on the cards.

The challenge wasn’t making server plans easier to read. It was making the decision behind them easier to understand.

The evidence: nine inputs, and where each one led

The evidence came from the people closest to traders: the recurring questions in support calls, the support team who took them, and the CEO who saw where sales stalled.

  1. People

    User needs How fast, how reliable, and whether a trader’s setup will run.

    05.505.3
  2. Business

    Business goals Plans understood and chosen with confidence; offers with somewhere to be found.

    05.4
  3. Product

    Product structure Three plan series and the pages around them.

    05.5
  4. Product

    Server configuration The CPU, GPU, memory, storage and network behind each plan.

    05.305.1
  5. Data

    Performance data Benchmark results for every plan.

    05.105.2
  6. Data

    Latency and uptime ChartVPS’s stated 0–1 ms latency to the exchange and 99.99% uptime, already part of the offer.

    04.305.1
  7. Journey

    Purchasing journey Arriving, comparing plans, checking out — from several starting points.

    05.5
  8. Business

    Promotions Offers that existed alongside the plans.

    05.4
  9. Constraint

    Technical constraints What the platform could actually offer — so the interface never overstates it.

    05.2
02 The complexityEvidence

Not a layout problem. A chain of translations.

Between a trader and a purchase sit six translations, each needing expertise the trader may not have. Every screen had to carry part of that chain without showing all of it.

  1. TraderTrading needs
  2. TraderPlatform
  3. TraderStrategy & workload
  4. MachineInfrastructure
  5. MachinePerformance
  6. ProductPlan
  7. ProductPurchase
The chain from a trader’s needs, platform and strategy, through infrastructure and performance, to a plan and a purchase. The first three are what traders know; the rest is what the product sold.

Five tensions the design had to hold

  1. Technical depth↔SimplicityTraders who know hardware need all of it; most need to see past it.
  2. Performance evidence↔Cognitive loadBenchmarks prove fit, but every added figure slows the choice.
  3. User expertise↔GuidanceThe right plan depends on knowledge the product can’t assume, without talking down to traders who have it.
  4. User needs↔Business goalsPlans must sell; advice must stay honest enough to trust.
  5. Many entry points↔One journeyOffers bring people in from outside the pricing flow; they still have to reach a plan.
03 My contributionOwnership

I owned the product design, end to end.

Over six months I owned the design of the ChartVPS digital experience, from product structure and decision journeys through interaction and UI. This case study follows one thread through that work: the decision to buy.

  1. Product strategyFraming the purchase as a decision, and where the product should carry it
  2. Information architectureProducts, plans, the Plan Finder and offers in one structure
  3. Decision journeysThree ways in, each ending at the same plan and purchase
  4. Interaction designThe Plan Finder, the benchmark panel and plan comparison
  5. UI and visual designThe pricing, performance, Plan Finder and promotional experience
04.1 The insightUnderstand

The problem wasn’t the amount of information. It was the gap between the specifications and the trading decision.

I read four separate complaints as one missing link. Each is a question the trader was left to answer alone.

The missing link

Nothing connected how someone trades to the plan they buy.

  1. Symptom 01Performance was hard to evaluateWhat do these specifications mean for my trading?
  2. Symptom 02Choosing a plan was difficultWhich plan fits my platform and workload?
  3. Symptom 03Pricing lacked contextWhat am I getting for the price?
  4. Symptom 04Offers were hard to findIs there an offer for what I need?
One missing link — from trading need, through infrastructure, performance and plan, to purchase — showing up as four symptoms: performance was hard to evaluate, choosing a plan was difficult, pricing lacked context, and offers were hard to find.

The four symptoms are the core problems the support team reported

From evidence to insight

Many plans, specifications and performance figures.

What mattered was knowing which characteristics fit a particular way of trading.

Benchmark scores existed for the hardware.

A score only helps once it’s placed against something and tied to a task a trader recognises.

Offers and several ways into the product.

Every route had to lead to the same decision, not away from it.

04.2 Key design decisionsDefine · Structure

Before designing screens, I designed the decision.

Four decisions shaped everything after. Each one is argued here, and shown in the solution.

Decision 01

Lead with performance, not hardware

Problem
Plan cards described the hardware, but not whether it fits a way of trading.
Decision
Make performance part of the purchase: benchmark bars under every price, latency in every specification.
Why
Traders don’t buy cores; they buy the confidence that their platform and strategy will run well.
Trade-off
Every metric on the card would bury the price. Each card carries two benchmark bars; the full breakdown moves to the benchmark panel, and the full specification stays, lower down.
See it in 05.1 Performance-led pricing
Decision 02

Give every number a reason to matter

Problem
A benchmark score on its own means little to most traders.
Decision
Pair each headline figure with a percentile, a comparison and the trading task it affects.
Why
The number proves it, the comparison sizes it, the context makes it matter.
Trade-off
Context costs words. Only headline figures get the full treatment; the rest are percentile bars, readable at a glance.
See it in 05.2 Contextual performance
Decision 03

Recommend, and show the cheaper option

Problem
Choosing a plan meant translating markets, style, platform and charts into hardware.
Decision
Ask five questions in trading terms, confirm the location, and return one plan with its reasons.
Why
A recommendation someone can check is one they can trust.
Trade-off
A finder can read as an upsell. Every result shows a cheaper plan beside it and a route to compare all plans — giving up the highest-priced answer to keep the advice credible.
See it in 05.3 Plan Finder
Decision 04

Connect every entry point to one journey

Problem
Plans, the Plan Finder and offers were separate starting points, and offers had no clear place in the journey.
Decision
Every route — plans, the Plan Finder or an offer — arrives at the same plan detail, performance and purchase.
Why
A trader should reach the same decision whichever way they come in.
Trade-off
An offer never stands alone: it always resolves to plans and their performance, so promotions follow the plan structure rather than their own.
Status
Live across the homepage and the individual pricing pages.
See it in 05.4 Promotions and 05.5 Connected purchasing journey
04.3 Information hierarchy

Order, not removal.

Nothing was removed; it was reordered. Quick signals first, evidence next, full detail last — there when it’s wanted, never in the way.

  1. Technical data
  2. Performance metrics
  3. Context
  4. Trading relevance
  5. User decision

Progressive disclosureThree levels

Level 01Quick decision signals

0–1 ms latency99.99% uptimeBenchmark bars

Level 02Performance evidence

PassMarkCPU MarkSingle-threadMemoryDiskGraphicsPercentiles

Level 03Technical detail

CPURAMStorageBandwidthArchitectureOther specifications

Three levels of information: quick signals first, then performance evidence, then full technical detail.
05.1 Performance-led pricingDecision 01

Make performance part of plan selection.

Three series, each read in one order: purpose, price, performance, capability, specification, action.

Both early options showed the benchmark. Neither made it read as one: it looked like one more spec.

Rejected Alpha Series card, option A: the header shows the subtitle Virtual private server and the price; CPU Mark, up to 28,135, is a highlighted first row of the specification list.
Option A · RejectedCPU Mark as a row in the specifications, where it read as one more spec rather than a benchmark test.
Rejected Alpha Series card, option B: the red header shows the subtitle Virtual private server, the price and, beneath it, a single CPU Mark figure, up to 28,135, followed by the CPU platform and the specification list.
Option B · RejectedA single score beside the price. It wasn’t clear what it measured, or that it was a benchmark result at all.
Final Alpha Series card: the subtitle CPU-first trading VPS, the price from $50 a month, then PassMark up to 10,816 and CPU Mark up to 28,135 as two percentile bars directly under the price, followed by CPU driven, AMD Ryzen 9 9950X, and the specification list.
FinalTwo labelled benchmark bars directly under the price, and a subtitle in trading terms, so the result reads as a test score, not a spec. Series compare on performance at a glance; the full breakdown lives in the benchmark panel.
ChartVPS pricing after the redesign: Alpha Series, CPU-first trading VPS, from $50 a month; Gamma Series, GPU-assisted trading VPS, from $100; Delta Series, dedicated server, from $250. Under each price, two benchmark bars show percentiles: PassMark up to 10,816 and CPU Mark up to 28,135 for Alpha, GPU Mark up to 10,200 and CPU Mark up to 53,000 for Gamma, GPU Mark up to 19,071 and CPU Mark up to 60,582 for Delta. Each card continues with its processor or GPU, a specification list ending in 0–1 ms latency, highlights naming the platforms and workloads it suits, and a Get started button.
After the redesignThe three series, now compared on performance: benchmark bars sit directly under each price, and latency closes every specification. One of them, the Gamma card, is taken apart alongside. Series names and pricing were set by the CEO; I designed the cards.

One card, four signals

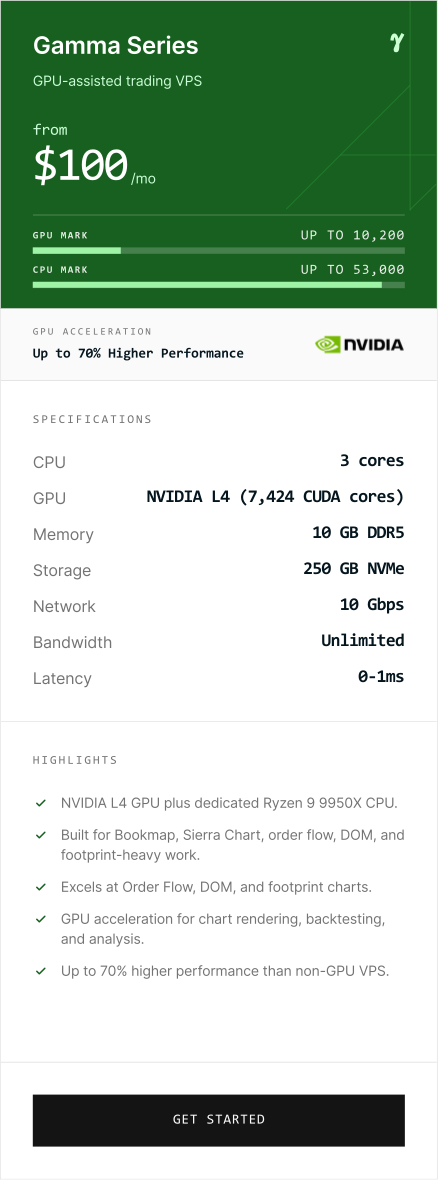
ChartVPS Gamma Series plan card: the subtitle GPU-assisted trading VPS, the price from $100 a month, GPU Mark up to 10,200 and CPU Mark up to 53,000 as two percentile bars under the price, a GPU acceleration band reading Up to 70% Higher Performance, the full specification ending in 0–1 ms latency, highlights naming the platforms and workloads it suits, and a Get started button.
1Starting priceStated early, so the rest of the card reads as what that price buys.
2PerformanceTwo benchmark bars on the card itself, so series compare at a glance.
3CapabilityThe series’ strength in one line, in trading terms.
4Technical depth, with latencyThe full specification stays — with 0–1 ms latency beside the hardware.

Every benchmark figure comes from a test server set up with the plan’s specification and measured with PassMark PerformanceTest. Bars show each score’s percentile against every computer in PassMark’s benchmark database, the same scale as the benchmark panel.

05.2 Contextual performanceDecision 02

Give every number a reason to matter.

Pick a series, then a plan. Every headline figure arrives as number, comparison, context and trading relevance.

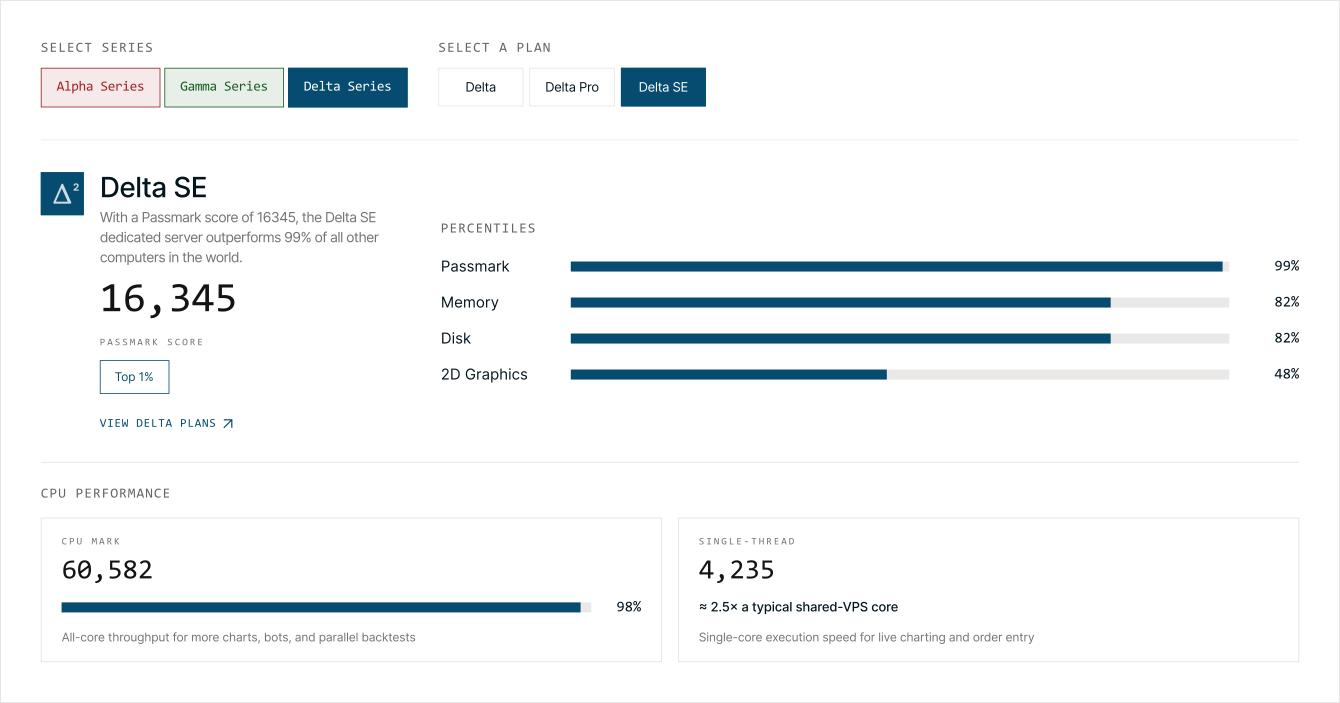
ChartVPS benchmark panel with Delta Series and the Delta SE dedicated server selected. A series selector and a plan selector sit at the top. Delta SE: PassMark score 16,345, described as outperforming 99% of all other computers in the world, marked Top 1%, with a link to view Delta plans. Percentile bars for PassMark, memory, disk and 2D graphics. Under CPU performance: CPU Mark 60,582, explained as all-core throughput for more charts, bots and parallel backtests; single-thread 4,235, about 2.5 times a typical shared-VPS core, explained as single-core execution speed for live charting and order entry.
The benchmark panelEvery figure arrives with a percentile, a plain-language comparison and the trading work it affects.
Detail of the benchmark panel: the single-thread card, 4,235, about 2.5 times a typical shared-VPS core, single-core execution speed for live charting and order entry.
Detail · Single-threadThe same card, enlarged: every layer below is on it.

One metric, four layers · single-thread

Number4,235
Comparison≈ 2.5× a typical shared-VPS core
ContextSingle-core execution speed
Trading relevanceLive charting and order entry

Typical = the PassMark single-thread average for shared-VPS cores.

05.3 Plan FinderDecision 03

A recommendation you can check.

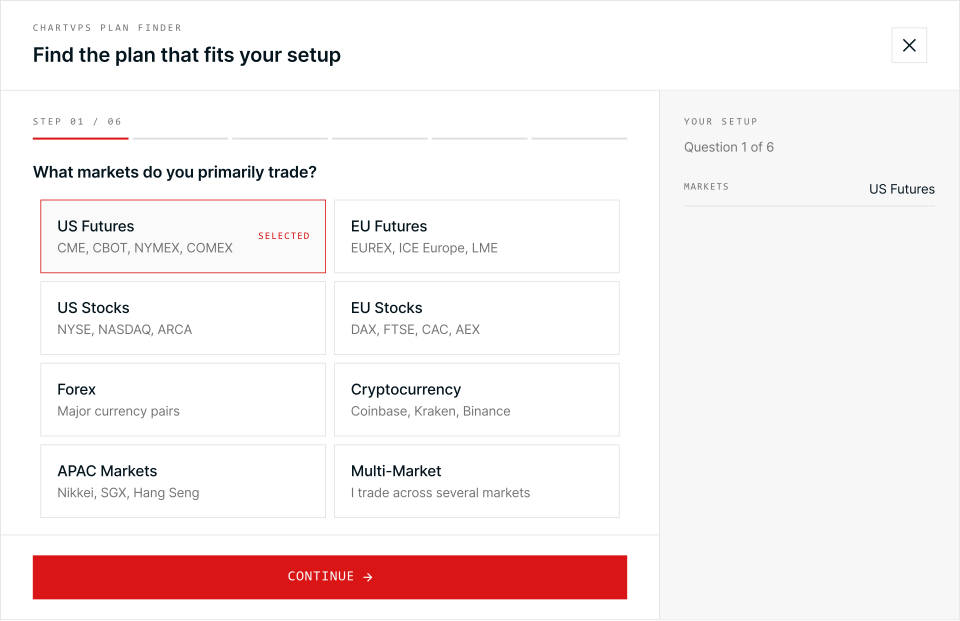
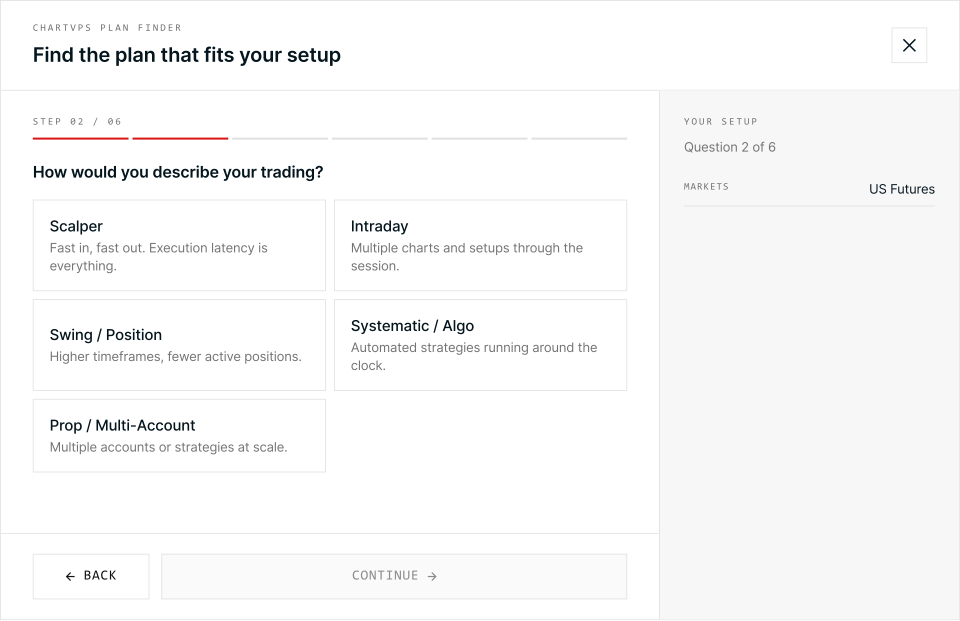
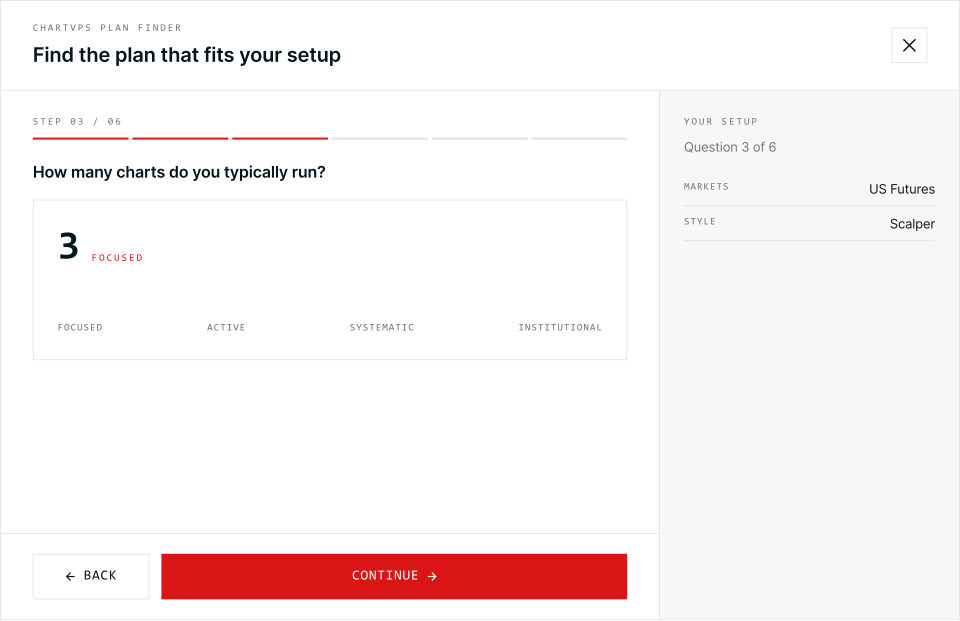
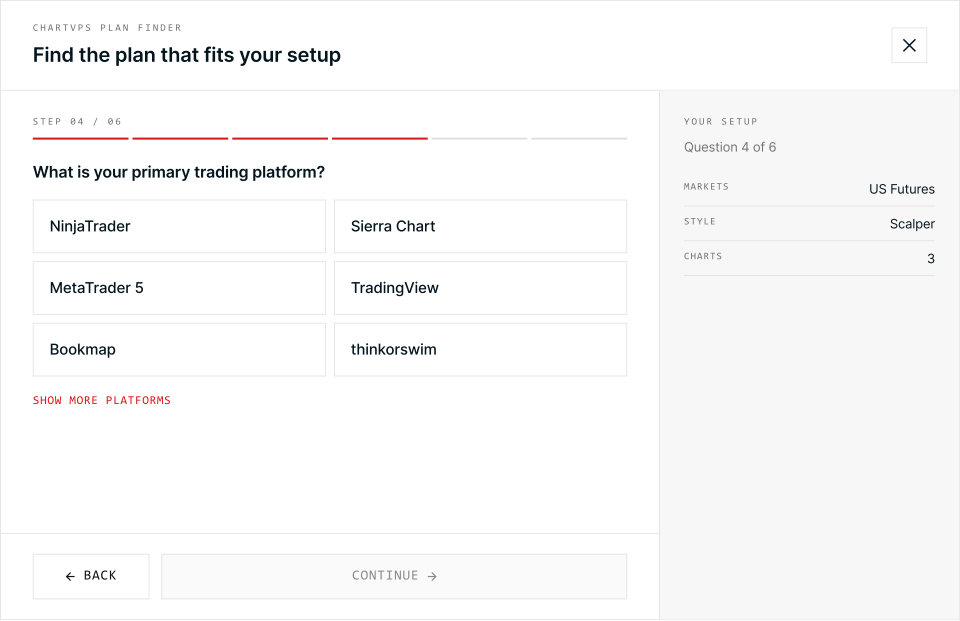
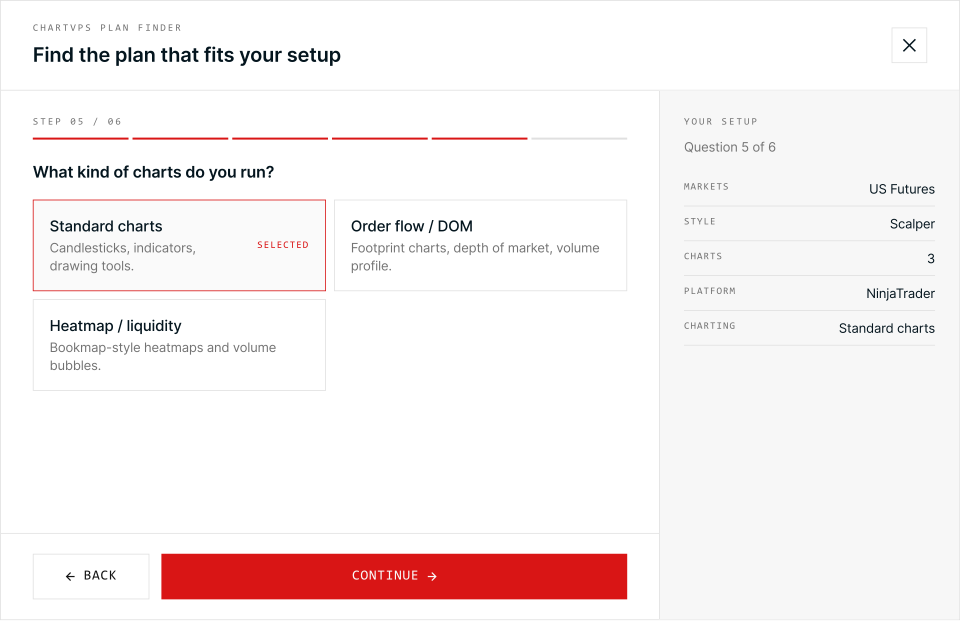
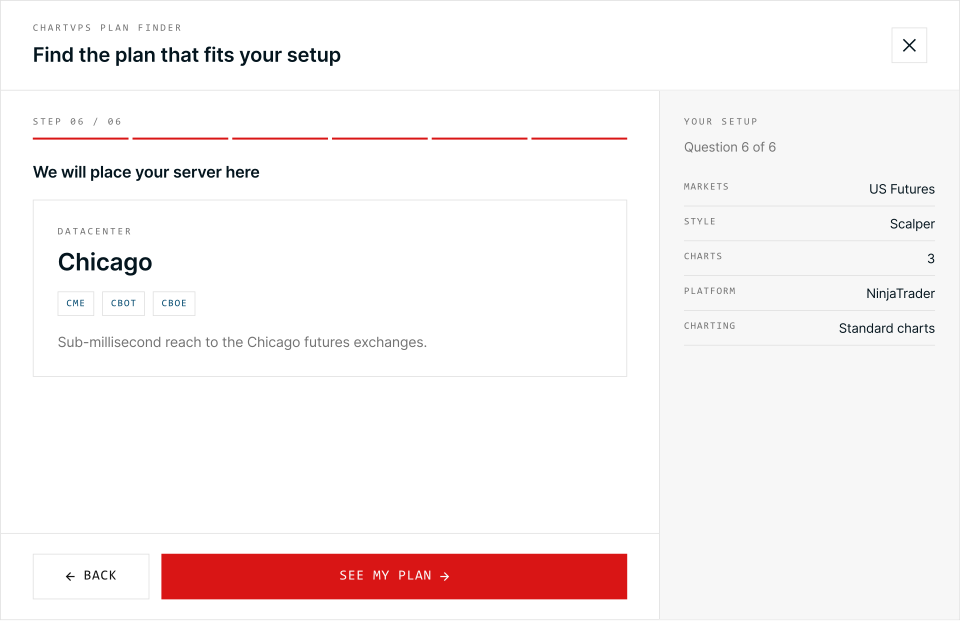
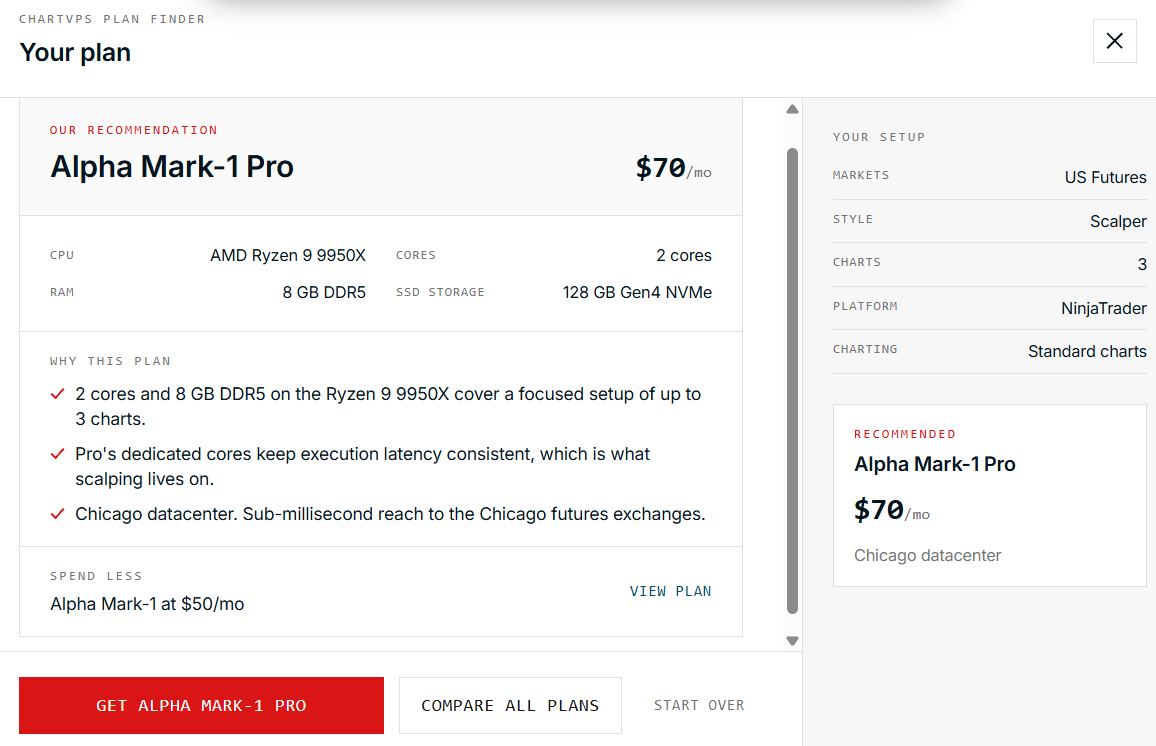
Seven screens: six steps from how someone trades, then one plan with its reasons and a cheaper option.

On the result screen · 07

  1. One recommendationA plan and its price, not a shortlist to decode.
  2. Why this planEach reason quotes an answer back — three charts, scalping, US futures — so the recommendation can be checked.
  3. Spend lessA cheaper plan beside it, so the finder never reads as an upsell.
  4. Three ways forwardTake the plan, compare all plans, or start over.
The decision model: six steps, their answers, and what each one shapes
  1. 01
    What markets do you primarily trade?US Futures · EU Futures · US Stocks · EU Stocks · Forex · Cryptocurrency · APAC Markets · Multi-Market
    Shapes: Where the server sits
  2. 02
    How would you describe your trading?Scalper · Intraday · Swing / Position · Systematic / Algo · Prop / Multi-Account
    Shapes: The workload, and how much latency matters
  3. 03
    How many charts do you typically run?A slider: Focused · Active · Systematic · Institutional
    Shapes: Cores and memory
  4. 04
    What is your primary trading platform?NinjaTrader · Sierra Chart · MetaTrader 5 · TradingView · Bookmap · thinkorswim · more
    Shapes: Platform requirements
  5. 05
    What kind of charts do you run?Standard charts · Order flow / DOM · Heatmap / liquidity
    Shapes: The performance required
  6. 06
    We will place your server hereNot a question: the datacenter that follows from the markets, with the exchanges it reaches
    Shapes: Confirms the location
  7. →
    Your planOne recommendation, its reasons, and a cheaper option
    The decision
05.4 PromotionsDecision 04

Offers that lead to a plan.

Promotions became another entry point into the same purchasing journey.

  1. Promotion
  2. Relevant plan
  3. Performance
  4. Purchase
ChartVPS Promotions page. A featured deal, Save more with 5% off plus 1 month free on annual plans, with Alpha, Gamma and Delta Series tags and a code to use. Below it, two offers, each with an action: save up to 10% per month when upgrading an existing Alpha plan, with a Chat now button; and Investology Pro free with ChartVPS plans, with an Investology button.
The Promotions pageThe featured deal names the series it applies to, and every offer leads to one clear action.
05.5 Connected purchasing journeyDecision 04

Three ways in. One decision.

Plans, the Plan Finder or an offer: every route arrives at the same plan detail, performance and purchase.

  1. Discover
  2. Understand
  3. Evaluate
  4. Match
  5. Compare
  6. Purchase
Homepage
ProductsPlan FinderPromotions
Plan details
Performance
Purchase
From the homepage, three entry points — products, the Plan Finder and promotions — all lead to plan details, then performance, then purchase.
  • Plan FinderA popup over the page. It ends on the recommended plan for how someone trades, with a link to all plans. See the screens in 05.3.
  • PromotionsThe Promotions page links to each series’ plans: Alpha, Gamma and Delta. An offer links to its specific plan while the offer is active.
06.1 OutcomeOutcome

What changed

Before“Which VPS should I buy?”

After“Which infrastructure fits the way I trade?”

Before, traders had to compare every plan’s specs and work out fit themselves. Now the product starts from how they trade and tells them which plan fits, and why.

User

What became easier

Performance and plan fit became easier to evaluate, starting from how someone trades rather than from a specification sheet.

Product

What became connected

Pricing, performance, plan selection and promotional entry points became one purchasing experience.

Business

What it supported

The support team reported fewer questions about which plan to choose, and the CEO saw better user growth.

System

What it established

One benchmark system across every series and plan: the same scores on the same percentile scale, so performance reads the same wherever it appears.

All four parts shipped and are live on chartvps.com: performance-led pricing, the benchmark panel, the Plan Finder and the Promotions page

06.2 Reflection

What’s next, and what stayed with me.

The redesign is live, and some of it changed how I work.

How I’d measure it

Drop-off between choosing a plan and payment, and the time it takes to choose a plan.

What I took from it

Support feedback is design evidence: working closely with that team shaped this project. And traders buy performance when it’s explained as what it does for their trading, not as hardware.